Methodology Behind the Map
Anne Chase, Brynn Nelson, Grace Wolf, Gabe Garcia
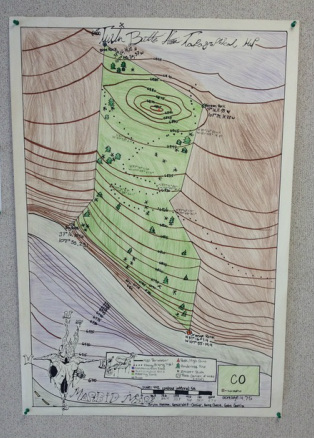
During this project we made a topographic map of a small area in the Twin Buttes above our school. In order to do so, the first step was to measure the bearings and paces. Since the corners of our mapping area were already plotted, we went to the bottom corner of the mapping area and counted the paces in-between each major bend all the way around the perimeter. We measured the latitude and longitude degrees with a compass in-between each bend as well. To turn this information into our map, we took the number of paces and turned it into a smaller scale in order to make it fit onto the paper properly. After we had this number, we took a protractor and recorded the same number of degrees we had previously recorded, we continued to draw the lines the right length and in the direction we had recorded until we had completed the whole map perimeter. Google Earth helped us plot contour lines by showing us not only the basic shape that the map should be but also basic grade changes throughout the area to draw our lines by. Contour lines are the lines on a topographic map that show differences in the elevation. Someone may need a topo map to see which path is the roughest, making It easier to decide where they should go or hike. Spatial awareness was needed in this project to show us the position of objects in relative to other objects via north, east, south, and west. This project showed us how to record certain area of terrain efficiently and so in a very effective way.
Anne Chase, Brynn Nelson, Grace Wolf, Gabe Garcia
During this project we made a topographic map of a small area in the Twin Buttes above our school. In order to do so, the first step was to measure the bearings and paces. Since the corners of our mapping area were already plotted, we went to the bottom corner of the mapping area and counted the paces in-between each major bend all the way around the perimeter. We measured the latitude and longitude degrees with a compass in-between each bend as well. To turn this information into our map, we took the number of paces and turned it into a smaller scale in order to make it fit onto the paper properly. After we had this number, we took a protractor and recorded the same number of degrees we had previously recorded, we continued to draw the lines the right length and in the direction we had recorded until we had completed the whole map perimeter. Google Earth helped us plot contour lines by showing us not only the basic shape that the map should be but also basic grade changes throughout the area to draw our lines by. Contour lines are the lines on a topographic map that show differences in the elevation. Someone may need a topo map to see which path is the roughest, making It easier to decide where they should go or hike. Spatial awareness was needed in this project to show us the position of objects in relative to other objects via north, east, south, and west. This project showed us how to record certain area of terrain efficiently and so in a very effective way.
 RSS Feed
